4. SpaceStudio Monitoring User Guide#
4.1. Introduction#
SpaceStudio offers an extensive monitoring infrastructure designed to allow monitor an architecture. When enabled, the monitoring infrastructure produces a database containing events that occurred during the simulation.
Moreover, SpaceStudio also provides code profiling support (perf) of embedded processors running Linux. Code profiling is available in simulation but also during FPGA execution.
When using the monitoring infrastructure, it is possible to retrieve information about inter-module communications, bus transactions, FIFO usage, and more. For a system designer, it is a useful tool to find communication bottlenecks, analyze system performance and debug faulty bus transactions.
4.1.1. Launching a simulation with monitoring activated#
Open a project
Right-click the architecture from the Project Explorer
From the menu, select Profile As then click on Launch in a simulator
4.1.2. Generated monitoring database#
When the simulation has ended, the resulting database is located at <PROJECT_ROOT>\solutions\<SOLUTION_NAME>\architectures\<ARCHITECTURE_NAME>\build\monitoring\monitoring.db3 where:
<PROJECT_ROOT>is the location of the project’s file (.spacestudio)<SOLUTION_NAME>is the name of the solution<ARCHITECTURE_NAME>is configuration’s name
The database file can be opened by any SQLite database browser (e.g. sqlitebrowser4).
4.2. Monitoring views#
The generated database contains raw data from monitored events in the system. From this database, SpaceStudio presents monitoring views for some of these events such as code profiling, cache analysis, module computation, processor load and FIFO usage.
These views are used to quickly assess the system performance and guide the system designer in the design system exploration (DSE).
4.2.1. Module computation#
The module computation view displays a pie chart of the module time allocation between communication time, communication wait time and computation time.
The communication time is the time needed to read/write data from the SpaceStudio communication API. The communication time accounts for data movement (excluding blocked time). When the communication blocks for some reason, this will be accounted in the communication wait time (see after)
The communication wait time refers to the time lost because the reader/writer was not ready. When a communication is blocked, the blocked time will be accounted in the communication wait time. For instance, when reading from an empty FIFO or writing to a full FIFO.
The computation time is the time allocated for everything that is not communication time and communication
wait time. This represents the time budget to compute the application function. For hardware-mapped modules,
the computation time is incremented by calls to hw_compute_latency() function. For software-mapped modules,
the computation time is incremented by the execution of the application on the processor’s model.
This view is accessible via the Project Explorer, as shown by Figure 4.1, or from the diagram, as shown by Figure 4.2.
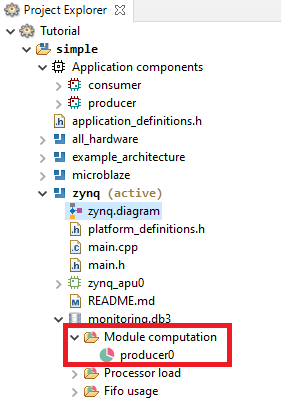
Figure 4.1 Accessing the module computation view from the project explorer.#
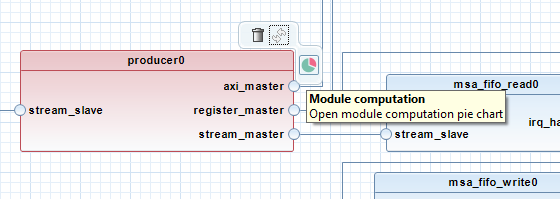
Figure 4.2 Accessing the module computation view from the diagram.#
Figure 4.3 shows the module computation view. When hovering over a section of the pie chart, a tooltip will show the percentage of this section.
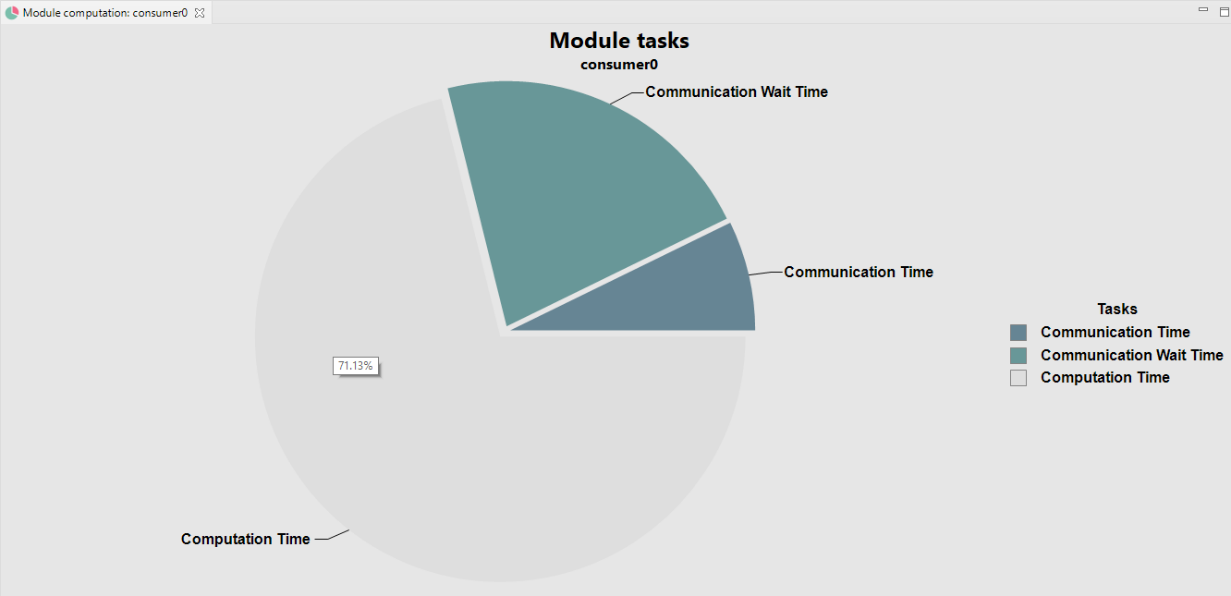
Figure 4.3 Module computation view.#
Note
The module computation view is available only for hardware modules and software modules running on a bare-metal OS.
4.2.2. Processor load#
The processor load view displays a pie chart of the time consumed (computation + communication) per module on the processor’s core. This view is used to highlight which module consumes most of the processor core’s time. For multi-core processors, there will be a view per core.
This view is accessible via the Project Explorer, as shown by Figure 4.4, or from the diagram, as shown by Figure 4.5.
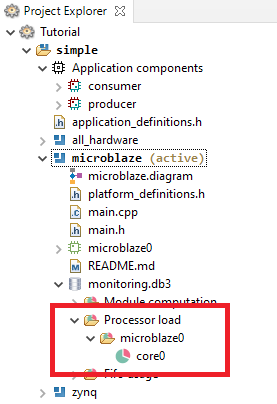
Figure 4.4 Accessing the processor load view from the project explorer.#
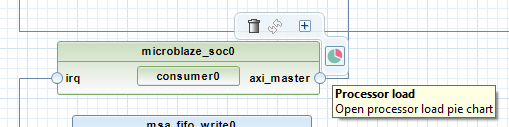
Figure 4.5 Accessing the processor load view from the diagram.#
Figure 4.6 shows the processor load view. When hovering over a section of the pie chart, a tooltip will show the percentage of this section.
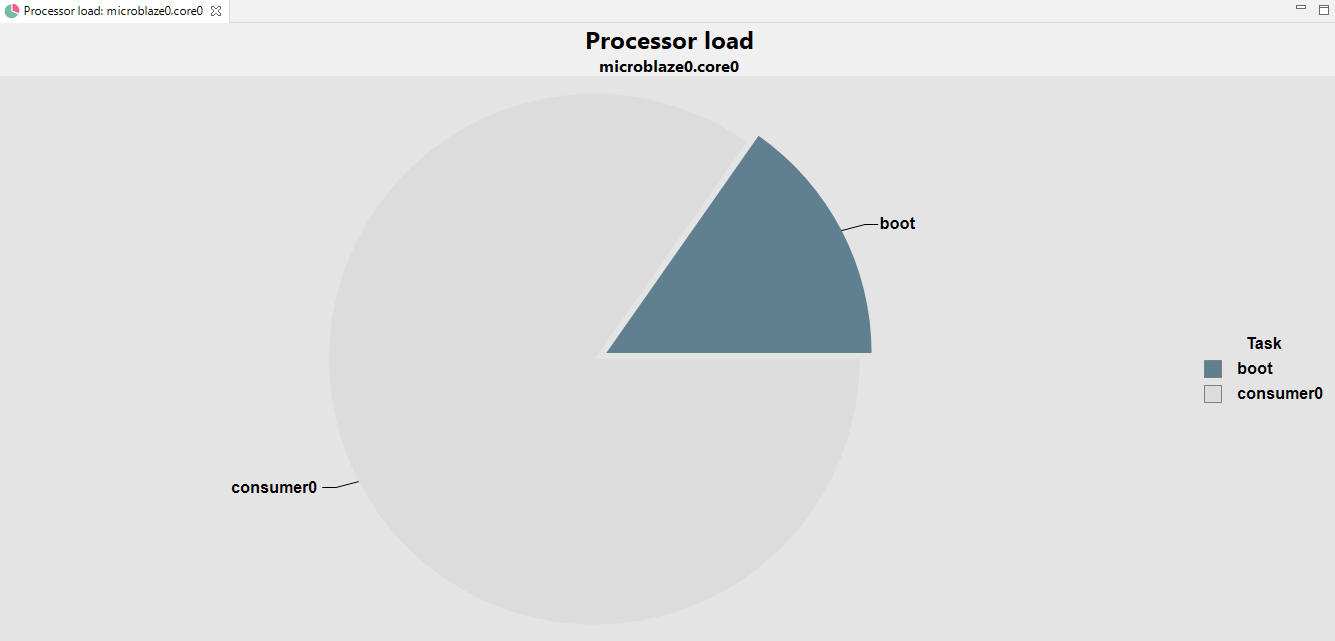
Figure 4.6 Processor load view.#
4.2.3. FIFO usage#
The FIFO usage view displays a pie chart of the slots used in the FIFO. This view is used to adjust the depth of the FIFO. For instance, if the FIFO is empty most of the time, the depth might be decreased without affecting the throughput of the application.
This view is accessible via the Project Explorer, as shown by Figure 4.7, or from the diagram, as shown by Figure 4.8.
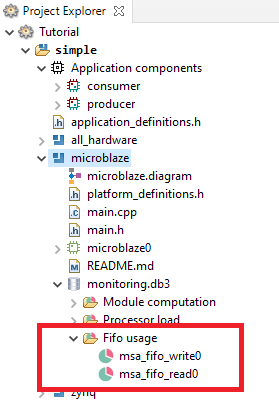
Figure 4.7 Accessing the FIFO usage view from the project explorer.#
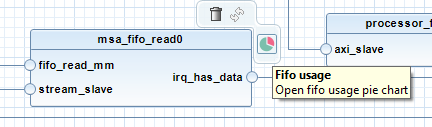
Figure 4.8 Accessing the FIFO usage view from the diagram.#
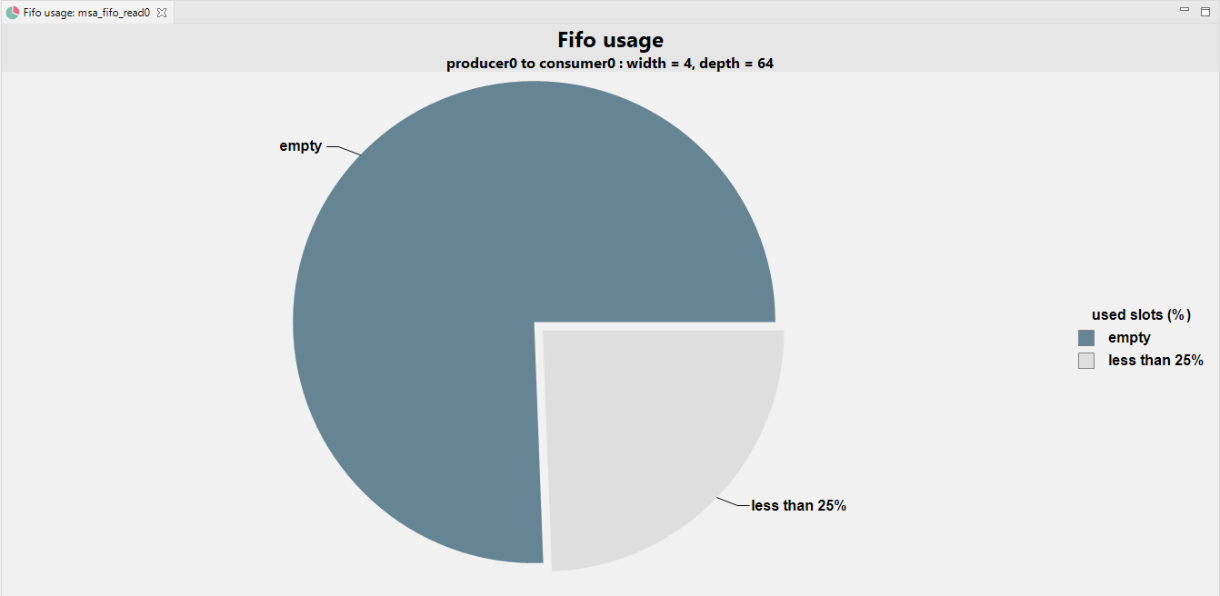
Figure 4.9 FIFO usage view.#
Figure 4.9 shows the FIFO usage view. When hovering over a section of the pie chart, a tooltip will show the percentage of this section. The pie chart is divided into several portions {“empty”, “less than 25%”, “25% - 50%”, “50% - 75%”, “more than 75%”, “full”}.
4.2.4. Code profiling#
SpaceStudio automatically invokes perf to generate code profiling. The resulting report appears in the architecture as a Markdown report in the Project Explorer view as seen in Figure 4.10.
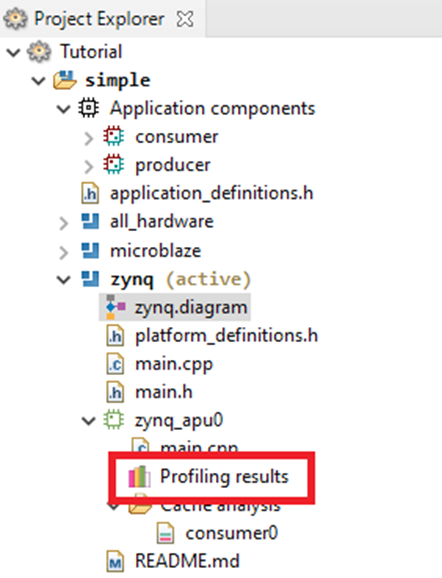
Figure 4.10 Accessing the code profiling view from the project explorer.#
Double-clicking on the Markdown report will open the report which contains relevante information about the execution as shown by Figure 4.11.
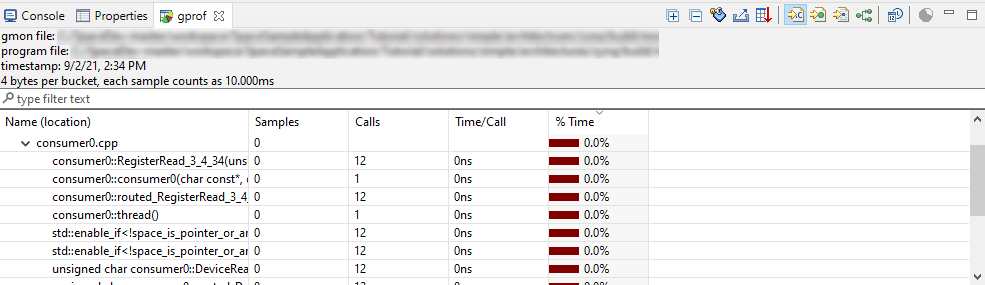
Figure 4.11 Code profiling view.#
Note
Code profiling is only available for software modules running on processor with Linux.
4.3. Database#
In this section, we present the complete description of the database schematic and the events monitored by the monitoring infrastructure.
Tables starting with the prefix cache_ contain computed data used by the viewer to speed up database requests.
All timestamps present in the database are SystemC’s timestamps (in picosecond) obtained with the function call sc_core::sc_time_stamp().value().
4.3.1. bus#
This table contains a list of id that refers to a bus. For example, if there are 3 buses in the virtual platform, this table will contain 3 entries which refer to an id of bus. The associated bus name can be determined using the table component.
Column |
Description |
|---|---|
|
ID of the bus |
4.3.2. bus_transaction#
This table traces every bus transaction during the simulation. Each entry of this table represents a master/slave communication (read and write).
|
|---|
|
|
|
|
|
Column |
Description |
|---|---|
|
Id of the bus |
|
Id of the module initiating the communication |
|
Id of the destination component |
|
Number of bytes transferred |
|
Absolute destination address |
|
Type of the current communication (refer to Table 4.2) |
|
Simulation time when the source request the bus access |
|
Simulation time when the data transfer starts |
|
Simulation time when the data transfer ends |
4.3.3. cache_bus_interaction_X#
This table contains all master and slave components using the bus X to communicate.
Column |
Description |
|---|---|
|
Id of the component |
4.3.4. cache_module_interaction_X#
This table contains a list of components that communicated (read and/or write) with the module (X).
Column |
Description |
|---|---|
|
Id of the component |
4.3.5. component#
The table component contains the id and name of all components found in the simulation.
Column |
Description |
|---|---|
|
Component id (as defined in |
|
Component instance name |
4.3.6. core#
This table contains a list of processor cores. For example, if there are 3 mono-core processors in the virtual platform, this table will contain 3 entries where each entry refers the id of the processor core. If a processor has two cores, both cores id will be in the table. The associated core name can be determined using the table component.
Column |
Description |
|---|---|
|
ID of the core |
4.3.7. end_of_simulation#
This table contains the simulation time of the end of the simulation.
Column |
Description |
|---|---|
|
Simulation time when simulation ended |
4.3.8. fifo#
This table contains a list of FIFOs. For example, if there are 3 FIFOs in the virtual platform, this table will contain 3 entries where each entry refers to an id of a FIFO. The associated FIFO name can be determined using the table component.
Column |
Description |
|---|---|
|
Id of the fifo |
|
Id of the master module inserting data into the fifo |
|
Id of the slave module reading data from the fifo |
4.3.9. fifo_usage#
This table contains information about the number of used slots in a FIFO and the operations executed on it. A new entry is added to this table after every read/write FIFO operation (blocking put, non-blocking put, blocking get and non-blocking get).
Column |
Description |
|---|---|
|
Id of the fifo |
|
The number of used slots (words) after the action |
|
Type of the action: a string “put” or “get” |
|
Simulation time when the event started |
|
Simulation time when the event ended |
|
Simulation time elapsed between the beginning and end of the operation |
4.3.10. max_fifo_usage#
This table is generated at the end of the simulation and presents the maximum number of used slots for each FIFO.
Column |
Description |
|---|---|
|
Id of the fifo |
|
The maximum number of used slots (words) |
4.3.11. memory_access#
This table contains all memory accesses. Each entry in the table happens when a memory receives an access through the API DeviceRead/DeviceWrite.
The origin_id represents the module id responsible for the access.
|
|---|
|
|
|
Column |
Description |
|---|---|
|
Id of the memory |
|
Id of the module accessing the memory |
|
Number of bytes transferred |
|
Type of the current communication (refer to Table 4.12) |
|
Address accessed |
|
Simulation time when the access starts |
|
Simulation time when the access ends |
4.3.12. memory_size#
This table contains a list of memory IDs and their sizes. For example, if there are 3 memories in the virtual platform, this table will contain 3 entries where each entry refers to a memory ID and its size. The associated memory name can be determined using the table component.
Column |
Description |
|---|---|
|
Id of the memory |
|
Memory size (in bytes) |
4.3.13. module#
This table contains a list of module IDs. For example, if there are 3 modules in the virtual platform, this table will contain 3 entries where each entry refers to a module id. The associated module name can be determined using the table component.
Column |
Description |
|---|---|
|
Id of the module |
4.3.14. module_communication#
This table contains all communications initiated by a module using the communication API function call (i.e. ModuleRead, ModuleWrite, DeviceRead, DeviceWrite, RegisterRead and RegisterWrite). Each entry in the table is triggered by the API call. The source_id is the module executing the API function call.
The status of the communication is one of the following:
success: the communication has been completed successfullyempty: a non-blocking communication could not be completed due to an empty FIFOfull: a non-blocking communication could not be completed due to a full FIFOerror: a communication could not be completed due to an unknown error
|
|---|
|
|
|
|
|
Column |
Description |
|---|---|
|
Id of the module initiating the communication |
|
Id of the destination component |
|
Number of bytes transferred |
|
Type of the current communication (refer to Table 4.16) |
|
“yes” or “no” depending if the communication is blocking or not |
|
Status of the communication |
|
Simulation time when the communication starts |
|
Simulation time when the communication ends |
Note
For a matching communication (ModuleWrite→ModuleRead), there are two entries: one entry for each source module.
For software modules, the processor is the source for RegisterRead and RegisterWrite communication.
Warning
All DMA function calls (Stream2Memory, Memory2Stream and Memory2Memory) are not monitored.
FIFO-based communication function calls (ModuleRead/ModuleWrite) implemented as software FIFOs are not monitored.
There is no module communication monitoring support for software modules on the SMP simulator.
There is no module communication monitoring support for software modules running on RTEMS.
4.3.15. module_communications_summary#
This table contains all information from the module_communication table with added time measurements for each communication.
Column |
Description |
|---|---|
|
Id of the module initiating the communication |
|
Id of the destination component |
|
Number of bytes transferred |
|
Type of the current communication (refer to Table 4.16) |
|
“yes” or “no” depending if the communication is blocking or not |
|
Status of the communication |
|
Simulation time when the communication starts |
|
Simulation time when the communication ends |
|
Simulation time elapsed transferring data |
|
Simulation time elapsed while the communication is stalled |
|
Simulation time elapsed between start and end of communication (includes both) |
4.3.16. module_summary#
This table contains a summary of computation, communication and wait time for each module.
Column |
Description |
|---|---|
module_id |
Id of the module |
communication_time |
Simulation time elapsed while doing communication |
computation_time |
Simulation time elapsed while doing computation |
communication_wait_time |
Simulation time elapsed while waiting |
communication_time_pct |
Amount of time doing communication relative to the total execution time of the module |
computation_time_pct |
Amount of time doing computation relative to the total execution time of the module |
communication_wait_time_pct |
Amount of time spent waiting while doing communications relative to the total execution time of the module |
Note
For software modules, the waiting time represents time being pre-empted by the OS.
For hardware modules, the waiting time represents time being blocked waiting for FIFOs. Either because it’s empty or full.
4.3.17. sw_event#
This table contains all relevant software events. The monitored software events are presented by Table 4.20.
Column |
Description |
|---|---|
|
The processor id or the core id. |
|
Software event (refer to Table 4.20) |
|
When event_type is task_schedule only. The module id that is running on the processor. |
|
The simulation time when the software event starts. |
|
The simulation time when the software event ends. |
For task_schedule event, the module_id represents the module id being executed on the processor. For boot, task_idle, irq_isr and os_io event, the module_id is irrelevant (NULL).
Note
There is no boot event for the SMP simulator.
There is no irq_isr event for the SMP simulator.
The event os_io is only supported for the SMP simulator.
Warning
There is no software event when running on RTEMS and FreeRTOS.